


Is the 2026 Crypto Bull Market Over? Key Signals to Watch
Bitcoin dropped below $70,000 on June 2, 2026, trading near $69,200 — roughly 45% below its cycle high of $126,296 set on October 6, 2025. Three red monthly candles in a row. Bitcoin dominance slipping under 60%. The Fear and Greed Index sitting at 23. Spot ETFs posting their largest single-week outflow of the year. Search interest in “Bitcoin bear market” at a five-year high.
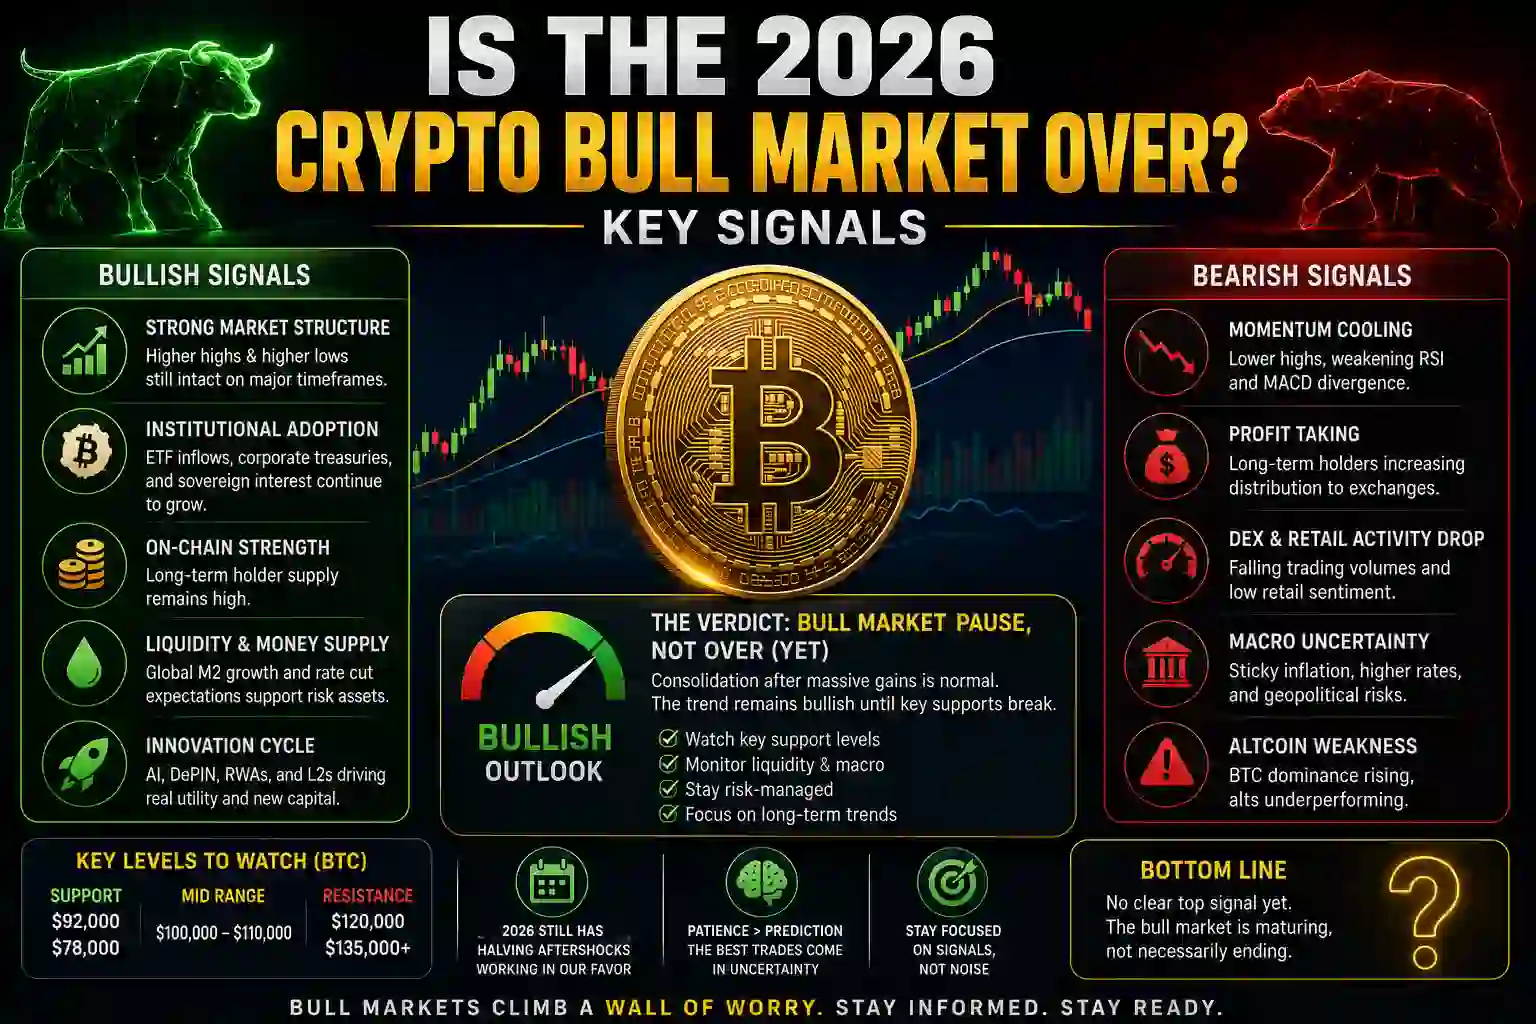
So is the 2026 crypto bull market over?
The honest answer: it depends on which framework you trust — and the frameworks disagree more sharply this cycle than any before it. Here is the bear case, the bull case, and why 2026 may not fit cleanly into either.
Where the Market Actually Stands
Bitcoin peaked at $126,296 on October 6, 2025, with some data feeds marking the intraday high closer to $128,198. What followed wasn’t a crash — it was a grind. A series of step-downs through late 2025 and into 2026 brought the price to around $69,200 as of early June, a 45% decline from the top.
By Bitcoin’s own historical standards, that’s not unusual. The 2021 cycle saw an 78% drawdown from $69,000 to $15,476. Prior cycles regularly produced 80%+ declines on the way to true bear-market bottoms. The current pullback is painful — but it’s still shallower than what a full historical bear market has delivered.
The surrounding signals are genuinely mixed. The crypto market overall sits around $2.41 trillion and shows an 84% correlation with the Dow — this is a macro-driven selloff, not a crypto-specific implosion. ETF outflows, while record-setting in streak length, still represent a small fraction of the capital that came in. The data doesn’t point to one obvious conclusion. It points to a market at a real crossroads.
The Bear Case: Why the Bull Market May Be Over
The bear argument rests on three pillars: cycle history, on-chain valuation, and a supply risk unique to this cycle.
The four-year cycle is the foundation. Bitcoin has historically moved in roughly four-year patterns tied to the halving, with 12 to 18 months of post-peak decline following each major top. The April 2024 halving put the typical bullish window into late 2025 and early 2026. Under that model, the October 2025 peak was the top, and 2026 is the reset year — the markdown phase that historically runs about a year and ends well below current levels.
On-chain valuation backs this up. The MVRV Z-Score, which compares Bitcoin’s market value to its realized value to flag when price has stretched too far from cost basis, has flashed signals consistent with a late-cycle top. Some on-chain frameworks put the potential downside zone for this cycle at $40,000 to $80,000 — meaning the current $69,000 could be the middle of the decline, not near its end.
The newest risk is supply. The market is now full of digital asset treasury companies — Strategy copycats that loaded their balance sheets with Bitcoin during the run-up. If those companies start selling into an already fragile market, the way Strategy did for the first time since 2022, the market may struggle to absorb that supply. A wave of treasury-company selling triggered by margin pressure or dividend obligations is the kind of reflexive shock that turns a correction into a bear market.
The bear case is coherent: the cycle clock says reset, valuations flagged a top, and there’s a fresh supply overhang no previous cycle had to deal with.
The Bull Case: Why This Could Still Be a Correction
The bull argument rests on institutional structure, ETF resilience, and the claim that the old cycle model no longer applies.
The institutional anchor is the strongest point. Spot Bitcoin ETFs now control more than $100 billion in assets. Despite the sharp pullback from the 2025 peak, cumulative outflows have stayed modest relative to everything that came in. The roughly $2.97 billion that left during the recent record outflow streak is under 8% of the $36 billion the category absorbed in its first full year. Regulated capital holding through a drawdown — rather than fleeing — is something no previous Bitcoin cycle had. It suggests a demand floor that simply didn’t exist in 2018 or 2022.
The macro setup could flip into a tailwind. Several major banks and brokerages entered 2026 with price targets in the $120,000 to $150,000 range. The thesis: a Federal Reserve pivot away from tight policy, combined with regulatory clarity from frameworks like the CLARITY Act and MiCA, releases liquidity back into risk assets. If the Fed signals rate cuts later in 2026, the same ETF infrastructure that is bleeding now becomes the channel through which fresh capital returns.
The deepest bull argument is that the four-year cycle is simply dead. A growing number of analysts argue the halving-driven model no longer fits a market dominated by institutions and ETFs rather than retail traders and miners. If the forces that produced clean four-year cycles have been overwhelmed by structural institutional demand that doesn’t operate on a halving clock, then “the cycle says 2026 is bearish” carries far less weight.
The bull case in short: the buyers who matter most are still here, the macro could turn positive, and the historical pattern pointing to a bear market may no longer be the right map.
Why 2026 May Not Fit Either Label
The most useful read might be that bull-or-bear is simply the wrong question for this cycle.
Several analysts have landed on a third view: 2026 is a year of divergence, not a clean directional market. Bitcoin may still drive overall sentiment, but other assets may stop following the way they did in prior cycles. You can already see it in the current tape — Bitcoin is bleeding while a handful of AI-linked tokens are posting double-digit gains. Dominance under 60% without a clean rotation into altcoins is exactly what a fragmenting market looks like.
The single label “bull” or “bear” assumes everything moves together. The defining feature of this cycle may be that things have stopped moving together.
That changes how you interpret the current decline. In a classic cycle, a 45% drawdown with extreme fear and three red monthly candles would be strong evidence of a bear market beginning. In a divergent, institutionally-anchored market, the same data could be a deep correction within a longer structural uptrend — with capital rotating between sectors rather than exiting entirely. The behavior of the market over the next few months will reveal which interpretation is right. The labels lag the data.
What to Actually Watch
If you want to know how this resolves without guessing, a few specific signals matter far more than the daily price.
The 50-week and 100-week moving averages are the cleanest structural line. A persistent hold above them keeps the bull-market-correction interpretation alive. A decisive, sustained break below them — paired with repeated failures to reclaim resistance — is the red flag analysts treat as confirmation of a deeper bear phase. This is a weeks-long signal, not a daily one.
ETF flow direction matters more than any single price level. The funds turning from net outflows back to sustained net inflows would signal institutional demand is reabsorbing the dip. Continued, broadening outflows signal the opposite. Watch the direction of the trend, not the size of any one day.
Treasury-company behavior is the cycle-specific wildcard. If digital asset treasuries beyond Strategy start selling Bitcoin in size to manage their balance sheets, that supply shock is the most likely trigger to convert this correction into a genuine bear market. If they hold, one of the bear case’s sharpest catalysts stays dormant.
The macro calendar is the external driver. Fed signaling on rate cuts, geopolitical risk, and whether the AI-equity trade holds all feed directly into crypto given the 84% correlation with the Dow. Crypto is trading on macro right now — so macro turns are what will move it.
The Bottom Line
Nobody knows yet. Anyone claiming certainty in either direction is overselling their framework.
The bear case is real: the four-year cycle says reset, on-chain metrics flagged a late-cycle top, and there’s a treasury-supply overhang no prior cycle carried. The bull case is equally real: institutional ETF capital has held through the drawdown, the macro could flip positive on a Fed pivot, and the cycle model itself may no longer apply to an institutionally-dominated market.
The most defensible position sits between them. This cycle has been different at every stage — a slow structural cooling rather than a 2021-style blow-off — and it may resolve as a year of divergence rather than a clean bull or bear. Stop asking for a label and start watching the signals: long-term moving averages, ETF flow direction, treasury-company selling, and the Fed. Those will tell you what this cycle is doing before any headline confidently declares it over.